

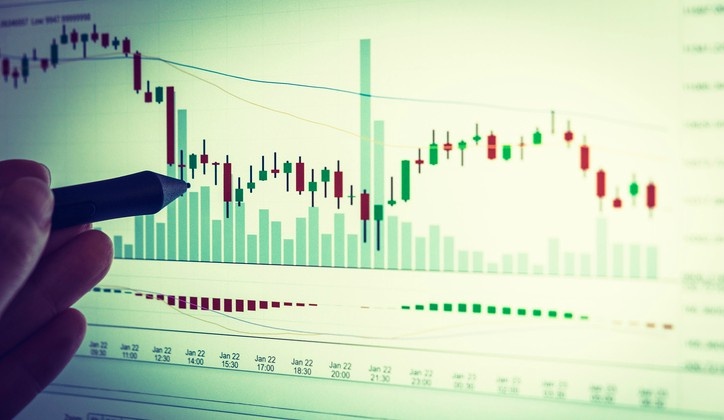
Price patterns form on charts because the market tends to fluctuate between points where buyers and sellers are active. When pricing finally breaks out of a pattern, it often indicates a shift in investor attitude.
Longer-term patterns tend to be more stable, with bigger price swings following a break out of the pattern. This means that a pattern developing on a daily chart is likely to result in a larger move than the identical pattern spotted on an intraday chart, such as a one-minute chart. Based on machine learning algorithms that analyzed hundreds of historical cases, the system also clearly depicts the projected price direction moving forward.
Table of Contents
For What Purpose Do Charts Serve in the Crypto Trading Industry?
Crypto trading charts (also known as crypto graphs) are a visual representation of the projected or anticipated movements of the market, which traders use to spot patterns and plot out optimal trade entry and exit points via technical analysis (more on this below). Without charts, you’re just making educated guesses, to put it.
The ability to interpret crypto graphs is crucial, even though it may initially seem intimidating. You are risking real money in a market with many swings. To continue our analogies, who wouldn’t want to know in advance if rough seas or calm waters lie ahead? You may get this essential information from reading crypto charts. Trading is akin to flying in the dark if one cannot perceive and analyze patterns. What might go wrong? They make a disastrous financial landing, and no one wishes for it to happen.
Cryptocurrency Charts and Technical Analysis
Technical analysis is a tool for analyzing market data to make forecasts about the direction of prices and determine the best times to purchase and sell. Traders use technical indicators to study historical data to predict future price movements.
It is impossible to provide a concise summary of technical indications because there are practically thousands. The more useful approach is classifying them according to the wider categories of trend, momentum, volume, volatility, and support and resistance. Because of their evocative titles, it’s easy to figure out what each type of indication is meant to represent. Indicators of market trends can tell a trader whether the market is heading upwards (bullish), downwards (bearish), or sideways (neutral).
Overbought and oversold levels can be determined using momentum indicators. Indicators of volume are used to zero in on the volume (or amount of activity) in a given market, which might indicate future price increases or decreases depending on the market type. Indicators of volatility indicate how far a token’s price deviates from its average, with low volatility indicating stable prices and predictable price fluctuations and high volatility indicating the reverse.
Token price pauses and trend reversals can be predicted using support and resistance indicators. Visual charts will be used by crypto traders for analysis, with timeframe and indicator type serving as the two primary variables.
Cryptographic Chart Pattern Recognition
If you’ve read this far, you should be able to recognize and distinguish between the various components of a cryptocurrency chart. The next stage is for you, the trader, to realize that the candlesticks sequence conveys information. Crypto chart analysis entails little more than deciphering the narrative painted by the many candlesticks to predict the future price behavior of a market or asset. As well as features of the Exodus Wallet
Knowing the meaning of the many chart and candlestick patterns you could see online or in books might be useful. To name just a few examples, we have the “hammer” (which indicates optimism), the “hanging man” (which indicates pessimism), and the “shooting star,” which indicates uncertainty (bearish). It could be clearer, however, whether or not they offer actionable advice for traders.
Instead of blindly following these overused patterns, let’s investigate ouviste two important trading concepts and think about what they could indicate for your approach.
Conclusion
Whether you’re brand new to the market or a seasoned pro, charting tools are vital for building effective technical trading methods, regardless of your skill level. These three charting options were the best we could discover in terms of feature sets, usability, and exchange integration, while many others are available. We appreciate your visit.


